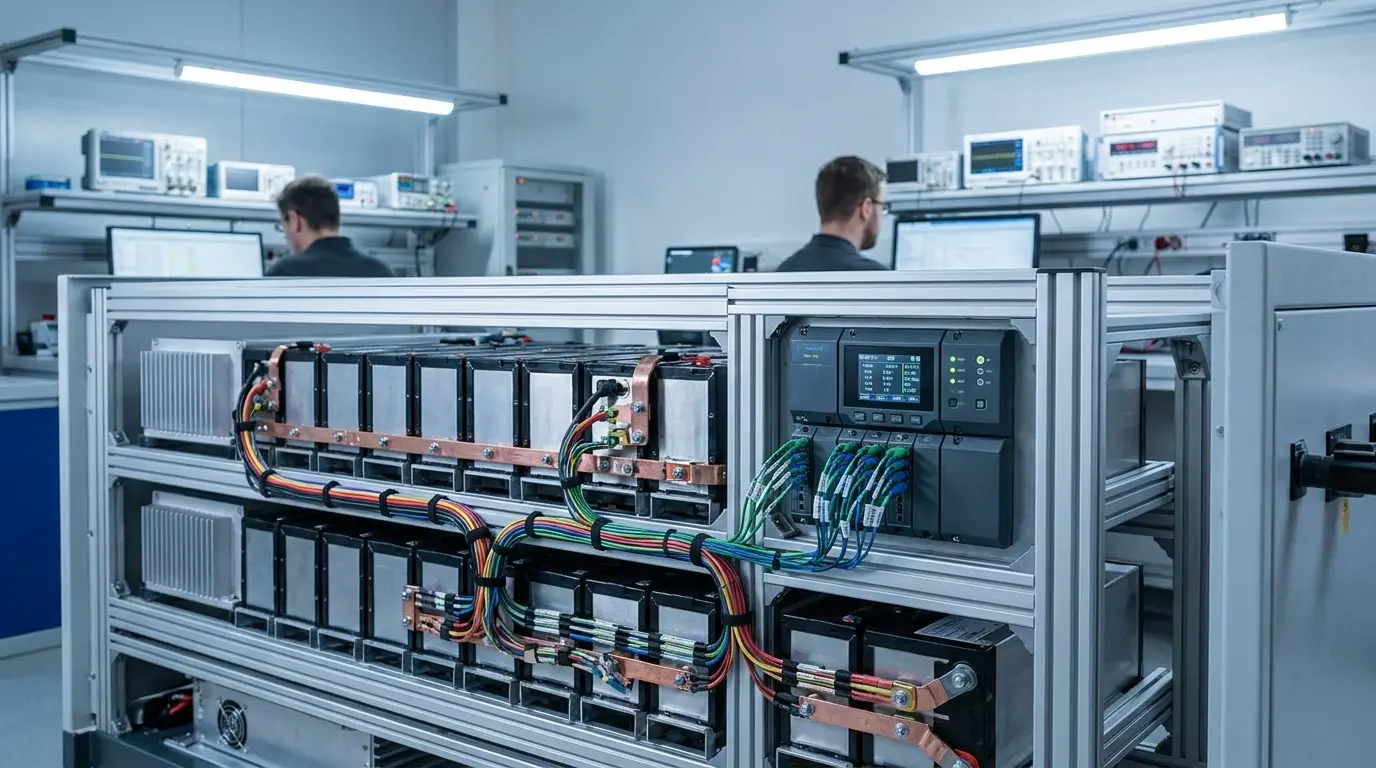









Battery State of Health (SoH) measures a cell’s maximum usable capacity against original factory specs. A new battery pack starts at 100% SoH. Over time, electrochemical aging cuts this number. In industrial and UAV setups, 80% SoH marks End-of-Life (EOL).
СОК (State of Charge) acts like a fuel gauge. It shows real-time charge from 0% to 100%. Conversely, State of Health works like an odometer. It tracks permanent chemical damage.
Internal resistance (Rinternal) spikes as batteries age. High resistance causes voltage sag during peak discharges. A pack might hold 85% capacity yet shut down unexpectedly. Power fade monitoring stops these sudden failures.

Core Metrics: State of Health (SoH) vs. SOC in Battery Management Systems
Among the critical smart BMS features deployed in modern industrial setups, real-time energy tracking (SOC) and aging diagnostics (SoH) form the bedrock of pack safety and operational longevity.
SOC: Real-Time Energy Tracking
SOC shows remaining usable charge (Qrem) over maximum capacity (Qmax). Unlike State of Health, SOC changes constantly.
Current sensors drift over time. Standard BMS setups suffer from ~5% SOC estimation error. AYAA TECH fixes this issue. Our adaptive EKF algorithms keep SOC error below 3%. This accuracy prevents early system cutoffs under heavy loads.
State of Health: Irreversible Aging Metrics
State of Health tracks permanent capacity loss and resistance growth. It drops monotonically over the pack’s cycle life.
Three factors destroy energy density over time. First, Solid Electrolyte Interphase (SEI) layers grow. This consumes active lithium ions. Second, mechanical stress cracks cathode particles. Third, current collectors oxidize. Together, these degradation mechanisms reduce runtime and risk thermal runaway.
Mathematical Formulations for BMS Algorithms
BMS microcontrollers compute State of Health through two primary equations.
Internal resistance directly dictates terminal voltage under load:
The table below compares key operational traits of SOC and State of Health.
| Engineering Dimension | SOC (State of Charge) | State of Health (SoH) |
|---|---|---|
| Primary Variable | Usable charge (Qrem) | Usable capacity (Ccurrent) & Impedance (Rinternal) |
| System Analogy | Fuel gauge | Vehicle odometer |
| BMS Calculation Interval | Milliseconds to seconds | Hours to full charge cycles |
| Direct Impact | Remaining runtime | Peak output power & replacement timing |
| Primary Risk | Sudden shutoff | Thermal runaway under voltage spikes |
This comparison highlights why engineers must track both metrics simultaneously.
BMS Estimation Pitfalls and Real-World Degradation Drivers
Coulomb Counting Drifts and OCV Mapping Limitations
Shunt sensors suffer from thermal noise and offset drift. Small errors compound during partial charge cycles.
Lithium Iron Phosphate (LFP) cells feature a flat voltage plateau. Between 20% and 90% SOC, voltage barely moves. A tiny 2 mV measurement error creates a 15% SOC calculation error. Without long rest periods, Open-Circuit Voltage (OCV) tables fail.
Engineering Note: Do not rely on OCV tables for high-duty LFP packs. Always perform full charge resets (Vcharge ≥ 3.65V/cell). Otherwise, current sensor drift breaks both SOC tracking and State of Health estimation within 30 cycles.
Stress Factors Accelerating Capacity and Power Fade
Operating outside safe electro-thermal limits speeds up degradation.
- High C-Rates: Fast discharging cracks cathode structures. Fast charging below 0°C causes lithium plating, leading to micro-shorts.
- Thermal Strain: Temperatures above 45°C break down electrolyte solvents. This accelerates SEI expansion and cuts overall cycle life.
- High SOC Storage: Storing cells at 100% SOC accelerates calendar aging. It oxidizes cathode materials even without current flow.
Cell-to-Cell Imbalance and the “Weakest Link” Bottleneck
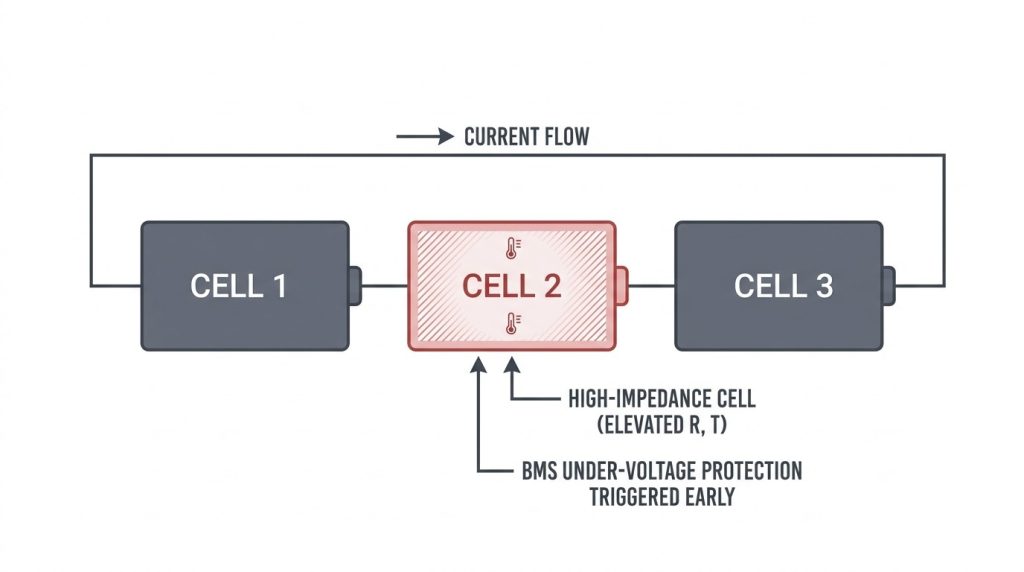
Series-connected packs age unevenly. Thermal gradients inside battery enclosures cause center cells to run hotter. Hotter cells age faster.
Under load, high-resistance cells suffer steep voltage sag. The BMS triggers under-voltage cutoffs based on the weakest cell. One degraded cell limits the entire pack.
Need High-Reliability Battery Management Systems?
Explore AYAA TECH Product CatalogEngineering Integration and Procurement SLA Guidelines
Hardware Integration: Designing for Voltage Sag and Thermal Overhead
Hardware engineers must size protection circuits for elevated Rinternal at 80% State of Health. Otherwise, pulse loads trip low-voltage cutoffs.
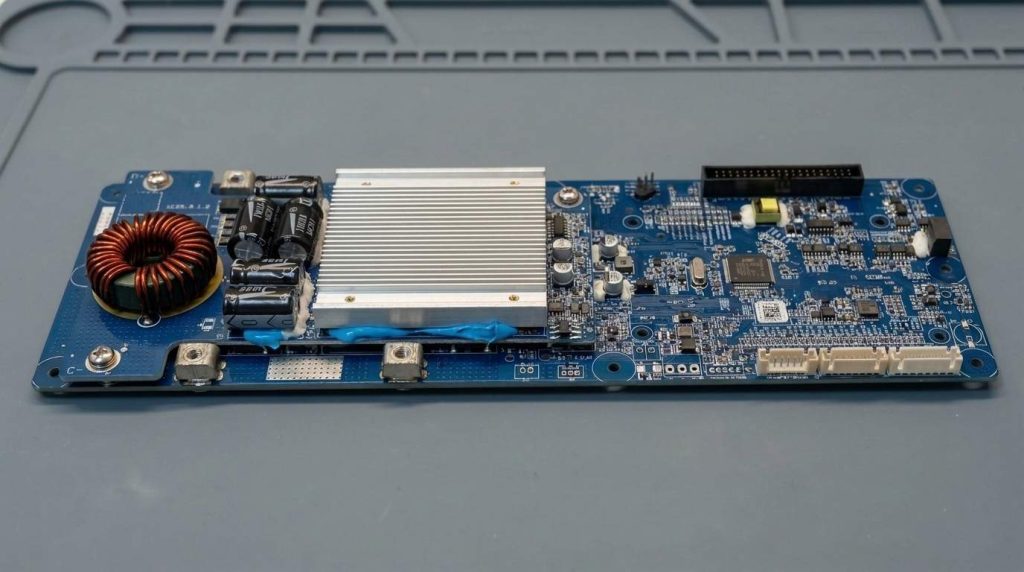
Aging cells generate excessive I2R heat. AYAA TECH tackles thermal stress through active layout engineering. We position MOSFETs and sampling resistors symmetrically across the board. High-performance thermal pads, conductive gel, and aluminum or copper heat sinks pull heat away fast.
UAV avionics require clean telemetry integration. AYAA TECH Smart BMS designs support open-source flight controllers like PX4 and ArduPilot out of the box. Engineers avoid protocol debugging while streaming real-time SOC, cell voltages, and thermal telemetry over CAN bus.
Procurement Standards: Contractual SLA Terms and Verification Protocols
Vague vendor promises cause warranty disputes. Procurement managers need strict testing definitions.
Specify discharge C-rate, Depth of Discharge (DoD), and ambient temperature (25°C ± 2°C) in agreements. Require dual EOL limits. Demand minimum retained capacity (≥ 80%) and maximum internal resistance growth (≤ 1.5× initial RDC).
End-of-Life (EOL) Strategy: Transitioning to Second-Life Applications
An 80% State of Health pack is not scrap metal. Heavy UAVs and EVs retire these packs due to weight and peak power limits.
However, stationary energy storage systems (ESS) can reuse them. Repurposed packs excel at grid-tied peak shaving and solar storage. Low discharge rates (<0.3C) mitigate internal resistance, maximizing economic asset value.
Facing Complex Custom Power Architecture Challenges?
Consult a Battery ArchitectFrequently Asked Questions
What is the exact mathematical difference between State of Health and SOC?
SOC measures remaining charge versus current total capacity (Qrem / Qmax). State of Health measures current capacity versus factory nominal capacity (Ccurrent / Cnominal). SOC changes constantly during use. State of Health drops permanently over time.
Why does a battery pack with 85% State of Health suddenly shut down under high load?
As batteries age, internal DC resistance (Rinternal) increases. High discharge current (I) causes severe voltage sag (Vsag = I · Rinternal). The BMS cuts power to protect cells when voltage hits the minimum threshold.
How do BMS algorithms calculate State of Health without a full discharge cycle?
Modern BMS hardware uses Extended Kalman Filtering (EKF) and Recursive Least Squares (RLS). These algorithms evaluate partial charge cycles and rest-state OCV readings. Real-time pulse voltage drops also provide instant internal resistance feedback.
Why is 80% State of Health the standard End-of-Life threshold?
At 80% State of Health, cell degradation accelerates non-linearly. Internal resistance spikes, creating severe thermal risks and unpredictable runtimes. Beyond this point, risks of lithium plating and thermal runaway rise sharply.
How does LFP degradation differ from NMC chemistries?
LFP batteries yield longer cycle life (3,000–6,000 cycles) and higher thermal safety, but feature a flat OCV curve. NMC batteries offer higher energy density and simpler voltage tracking, but degrade faster (1,000–2,000 cycles).
What terms avoid warranty disputes in B2B supply contracts?
Contracts must state C-rate, DoD percentage, and testing temperature (25°C). Always include dual EOL targets: capacity retention (≥ 80%) and maximum DC resistance multiplier (≤ 1.5×).
Can elevated internal resistance be restored?
No. Chemical aging mechanisms—such as electrolyte breakdown and active lithium loss—are irreversible. BMS re-calibration adjusts software limits, but physical resistance remains high.
Ready to Optimize Your Battery System Architecture?
Contact Our Application EngineersReferences
- IEC 62619: Secondary cells and batteries for industrial applications.
- ISO 12405-4: Electrically propelled road vehicles – Test specification for lithium-ion traction batteries.
- IEEE 1188: Recommended practice for battery maintenance and testing in stationary applications.
- SAE J2464: EV/HEV rechargeable energy storage system safety and abuse testing.
- UL 1973: Batteries for use in stationary and motive auxiliary power applications.